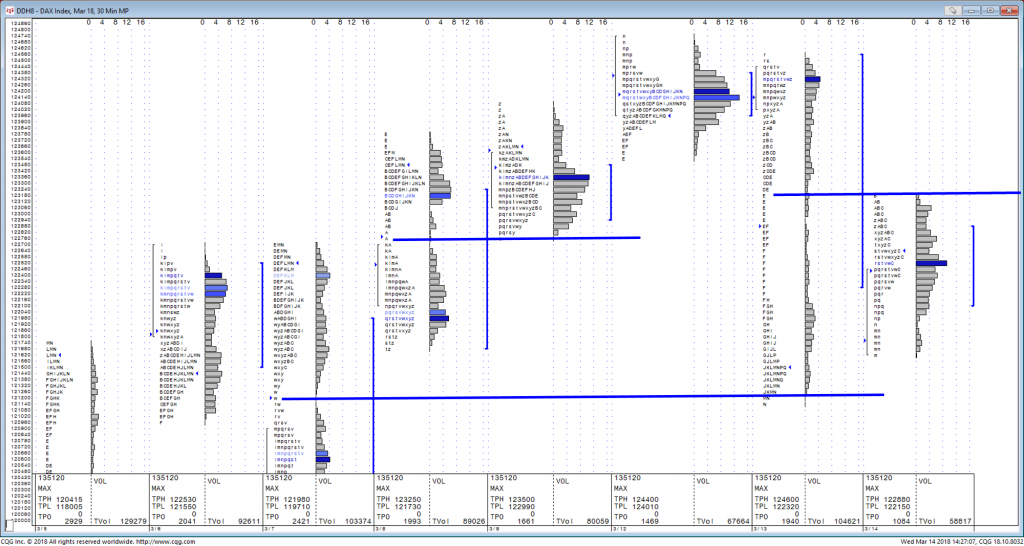
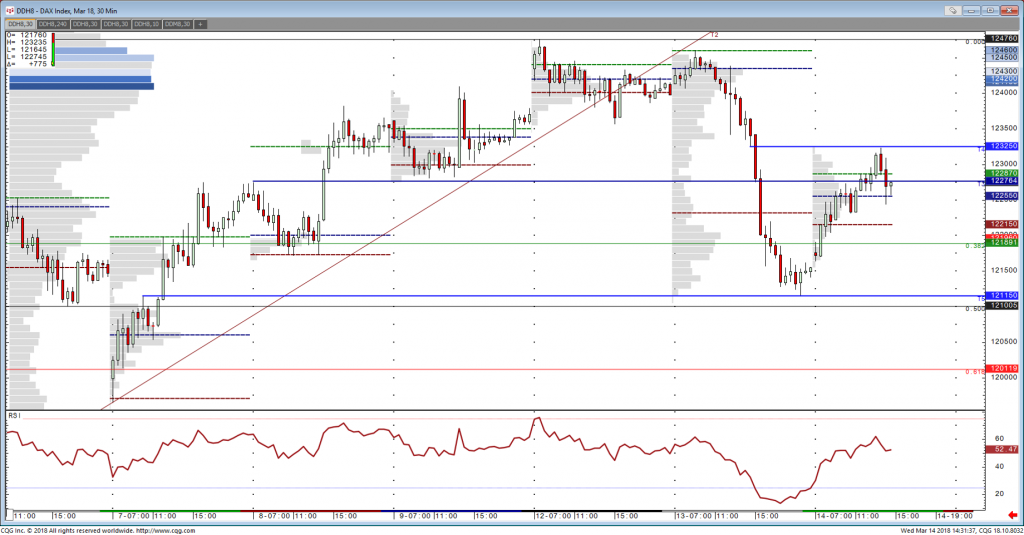
Tonight I am lecturing at the London School of Economics for the UK Society of Technical Analysts as part of their annual Diploma Course. My subject matter for the evening is Market Profile, something we used extensively in our reports. Below are two charts. The first one shows the Market Profiles for the DAX over the last 8 days. The blue lines are “Single Print Vacuums”, and if you look from each of these to the right you’ll see how they have “come into play” as support or resistance after they’ve been “created”. Yesterday’s low and today’s high (so far!) have both been BANG ON vacuum levels from earilier sessions. If you don’t have Profile on your charting system have no fear. You can spot these on 30 minute candle charts, as per our second chart.
Alternatively why not subscribe to our Analysis or ask for a no obligation free trial where you’ll get these levels in your Inbox prior to the open every day?!


