Chart action in Bond Futures has been pretty well behaved of late and things could be about to get a whole heap more interesting. Let’s take a look at what’s been, and what could be around the corner:
Bund Futures
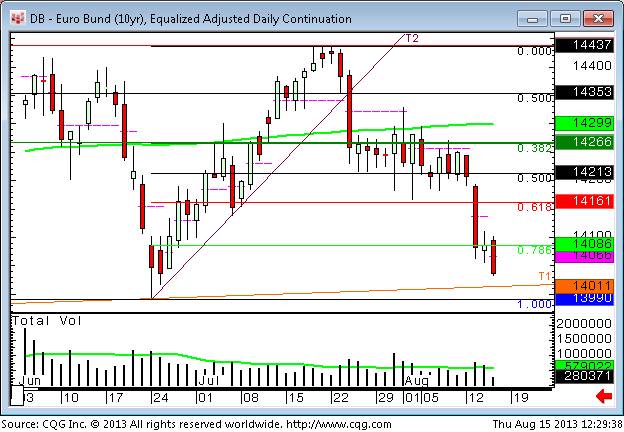
Chart 1: Bund Daily Candle Chart since June.
July 24th saw a break of a short term uptrend support line after a failure at the key 61.8% Fibonacci resistance at 144.37 a few days earlier. This prompted a bout of selling that was followed by a period of consolidation between July 25th and Tuesday August 13th. This consolidation ended on Tuesday as the sellers returned triggered by the ZEW number. We have since seen sustained selling and now sit just above a couple of really important support levels.
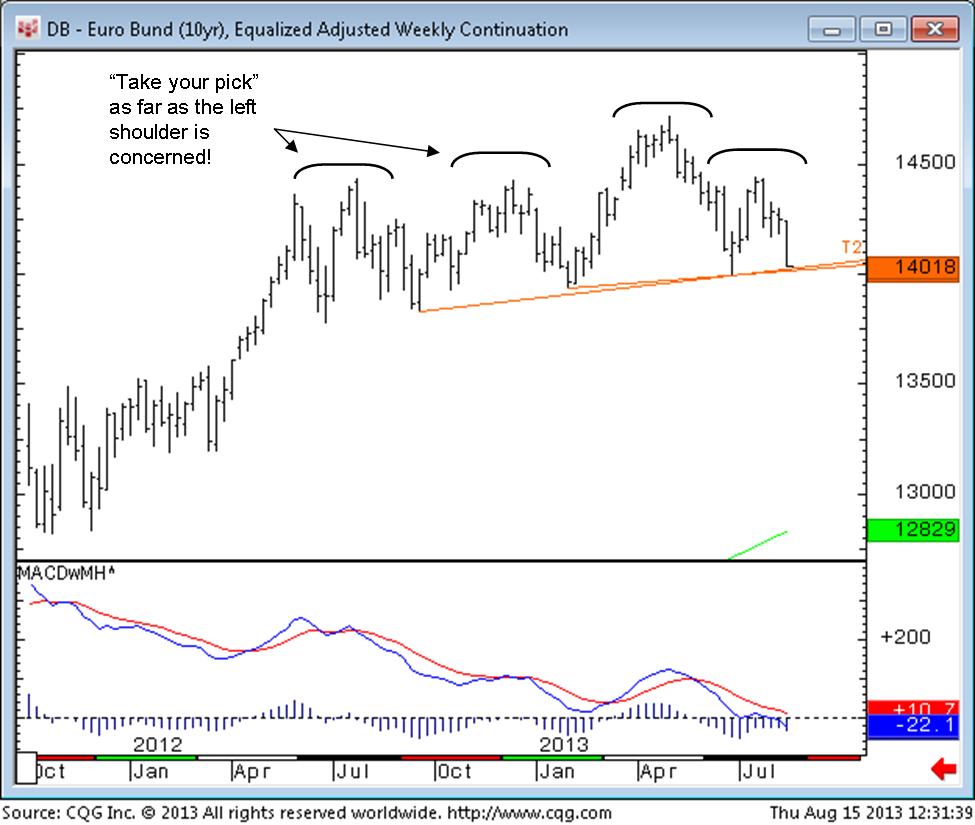
Chart 2: Bund Weekly Bar Chart
Chart 2 above shows a potential “Head and Shoulders” top that has been building in the Bund for almost a year now. We are very close to hitting the Neckline of this pattern (there are two candidates for the Neckline depending on what you want to class as the left shoulder, but in this instance there is little to chose between them).
This Neckline is at 140.10. The June low/bounce was 139.90. So 139.90-140.10 is a MASSIVE area of support. With Head and Shoulders patterns there is a “measured move” target that can be gleaned, and in this instance the suggested downside target on a break of the Neckline is 132.68. Interim supports to watch (the big ones) on the way down are 137.82, 135.79 and 134.21.
Gilt Futures
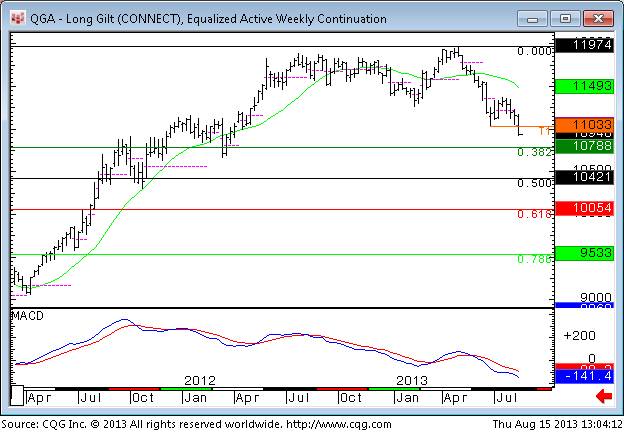
Gilts have looked “heavy” compared to their German counterpart for a while now. There was a big gap on June 20th on the open that’s never been recovered and capped upside in mid July on an attempted rally. 110.33 was the June low. This level saw a clean break on Tuesday afternoon and since then we’ve traded down to 109.22.
Chart 3: Gilt Futures Weekly Bar Chart
107.88 and 106.65 are the next downside targets and we are currently looking to sell into strength while 110.33-59 is above us.
10 Year Treasury Notes
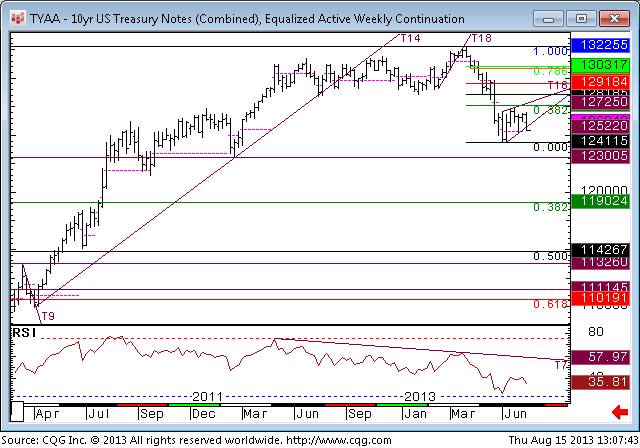
I’ve felt like a bit of a stuck record in this one on our daily reports of late, as I’ve been a firm bear despite the recent attempted rallies. This is paying off now as the market looks set fair to head back to the recent low at 124.115, set on July 5th.
The mid June sell off broke an important area of support around 128.00-16 and it’s never looked like sustaining a rally since. We have downside targets of 123.04, 121.17 and 119.025 if/when the down leg unfolds in the coming weeks/months as we expect.
Chart 4: 10 Year Treasury Notes Weekly Bar Chart
To get our up to date, daily views on the key levels and developments in these markets and others (see the list below) please click HERE to request a FREE TRIAL.
Our clients number Brokers, Fund Managers, and Prop Traders, all benefiting from our reliable and timely analysis.
FuturesTechs has been established since 2000, is an FCA registered company, and is one of the leading Independent Technical Analysis companies in the UK.
We use Candlestick Analysis, Market Profile and Auction Market Theory as the backbones of our daily Analysis.
Bond/STIR Futures Coverage:
- Bund
- Bobl
- Schatz
- 3 Month Euribor
- Long Gilt
- 3 Month Short Sterling
- 10 Year Treasury Notes
- 3 Month Eurodollars
We also cover Commodity, Equity and FX Markets.


