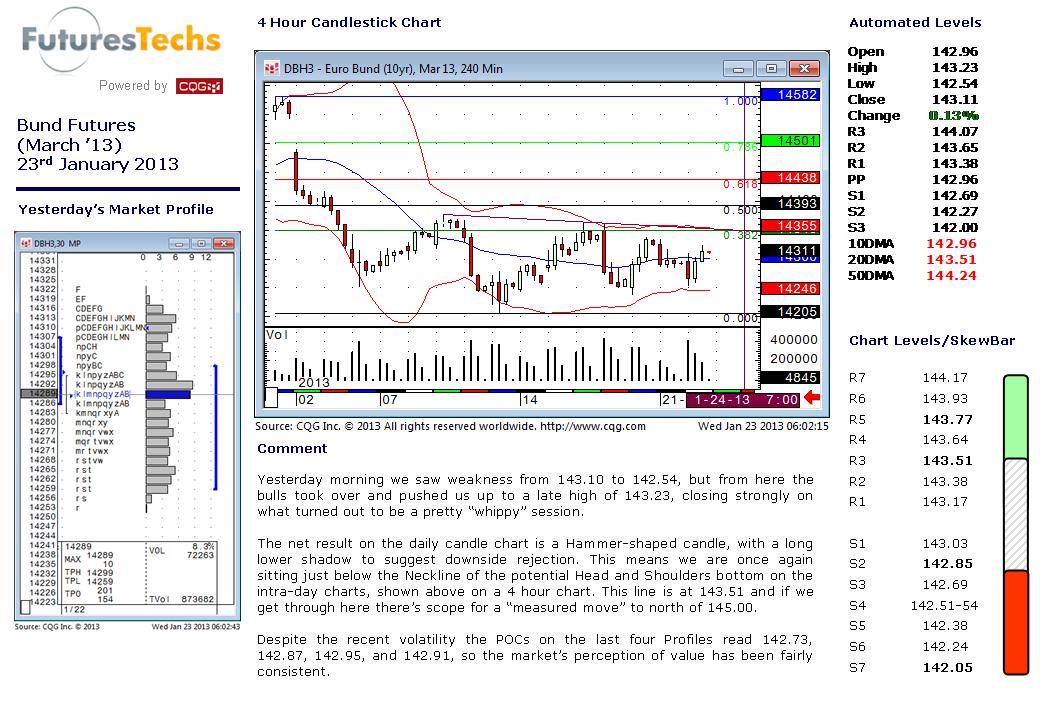
Today’s Bund Analysis centered around a possible Head and Shoulders pattern that’s forming on the intra-day charts. So far this morning’s price action has seen a failure at the Neckline of this potential pattern.
Here’s the analysis we sent out pre the 7am open:
Yesterday morning we saw weakness from 143.10 to 142.54, but from here the bulls took over and pushed us up to a late high of 143.23, closing strongly on what turned out to be a pretty “whippy” session.
The net result on the daily candle chart is a Hammer-shaped candle, with a long lower shadow to suggest downside rejection. This means we are once again sitting just below the Neckline of the potential Head and Shoulders bottom on the intra-day charts, shown above on a 4 hour chart. This line is at 143.51 and if we get through here there’s scope for a “measured move” to north of 145.00.
Despite the recent volatility the POCs on the last four Profiles read 142.73, 142.87, 142.95, and 142.91, so the market’s perception of value has been fairly consistent.
R7 144.17
R6 143.93
R5 143.77
R4 143.64
R3 143.51
R2 143.38
R1 143.17
S1 143.03
S2 142.85
S3 142.69
S4 142.51-54
S5 142.38
S6 142.24
S7 142.05
.
.
Feel free to regsiter for a Free Trial here.

