The RBA cut rates 25 bps overnight and the Aussie has weakened against the US Dollar. What next for this currency pair? What do the charts say?
Market Profile and Candlesticks are the two main “building blocks” of our analysis here at FuturesTechs. Let’s look at these to give further clues as to futures direction for this pair.
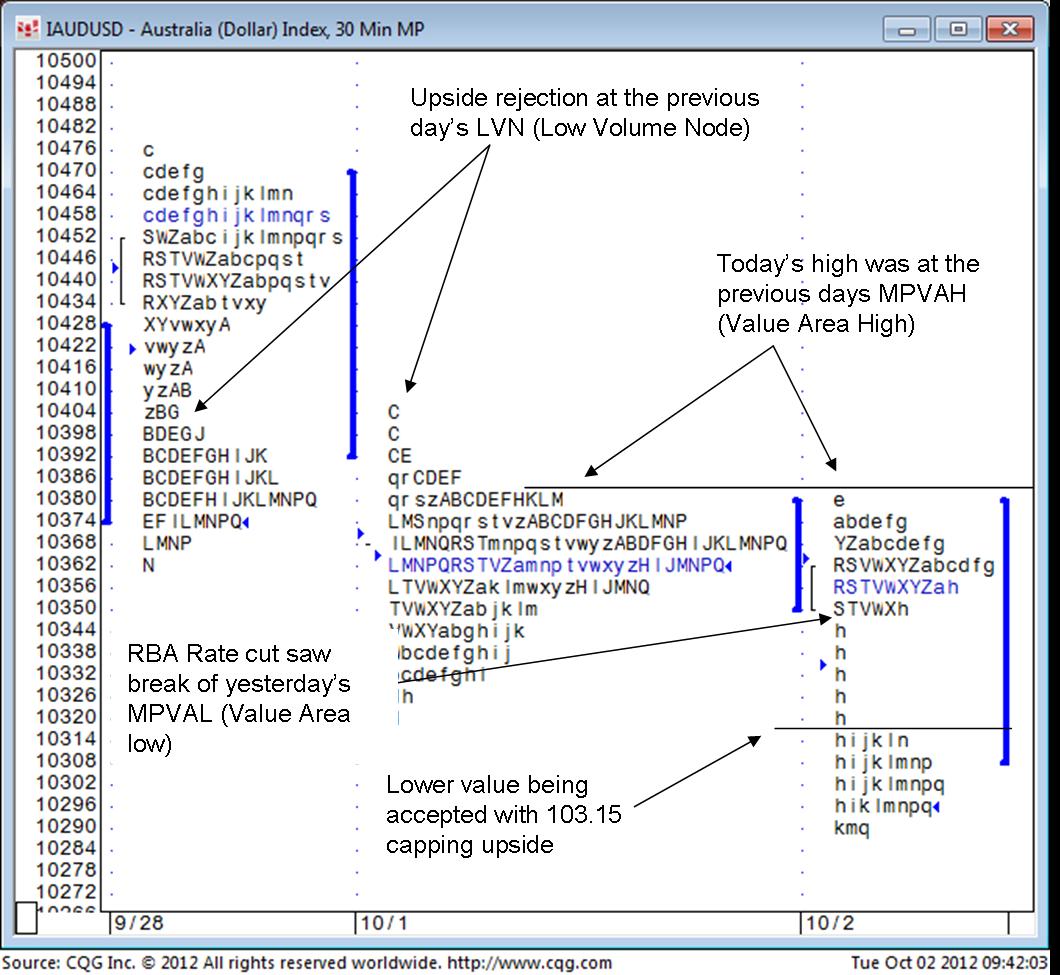
The chart below is the Market Profile, in basic terms this provides a daily “Volume at Price” histogram. We have a number of Blog articles that dig deeper into this form of analysis if you’re a newbie.
We have annotated this chart with the key “takes” from recent price action, and hopefully you can see the power of the Profile from this. The selling seen on the rate cut has created a “Single Print Vacuum” between 103.20and 103.49 which is now an area of resistance although the bottom annotation highlights how well 1.0315 has done as resistance since the cut.
So the Profile chart is painting a bearish outlook for now, with lower prices being accepted after a number of clear failures at resistance in recent sessions.
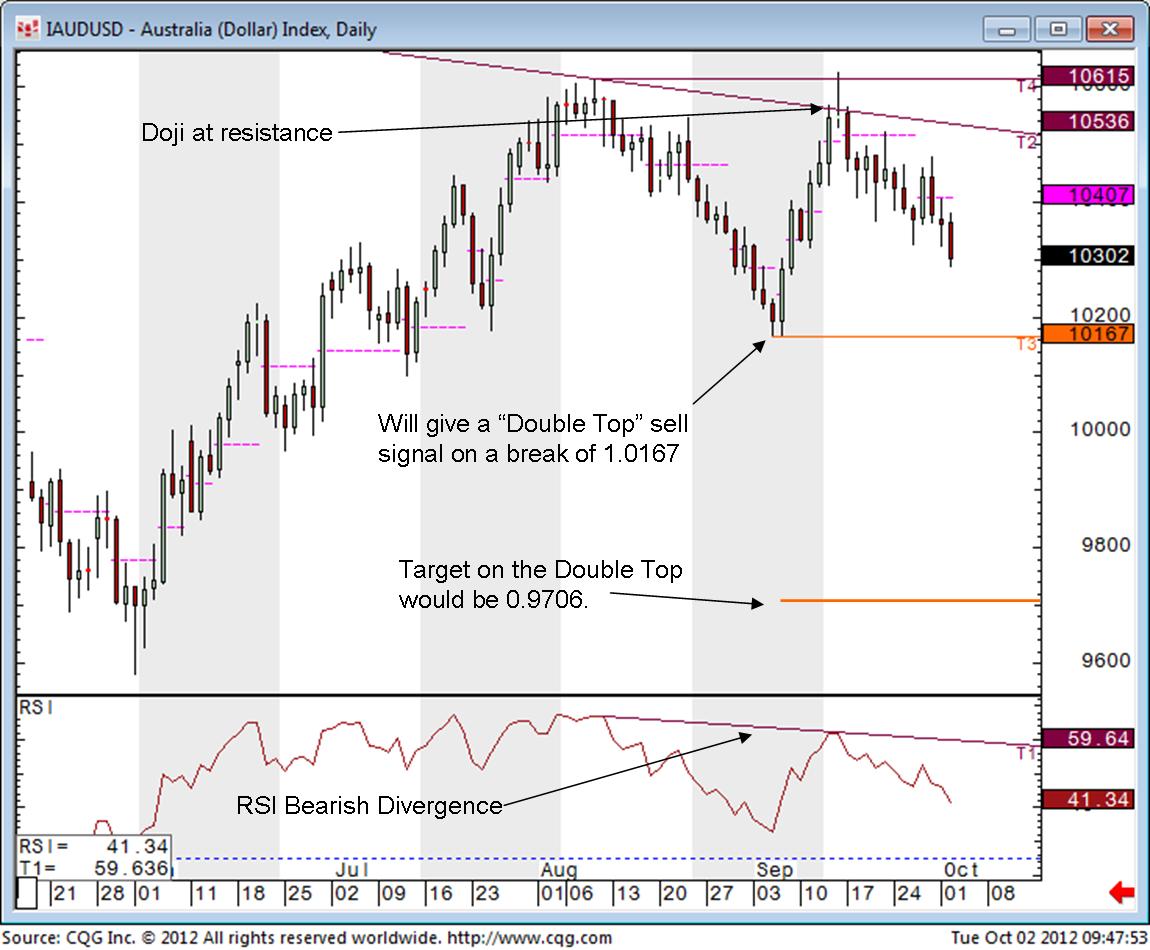
Next week move to the Candlestick chart to offer some “bigger picture” clarity.
This shows a Shooting Star/Doji candle at the recent high, which was bang on resistance. At this time we also posted a lower high on the RSI, something known as a Bearish Divergence. The market has sold off since, aided of course by this morning’s cut. 1.1067 is a key support level that’s now coming into focus and IF we see weakness through 1.1067 we get a “Double Top” sell signal with a “measured move” target of 0.9707.
This is still an “if” at present, though, and it’s not advised to pre-empt these signals unless (as is the case here) there is further evidence that the sellers are up to the task.
From this Thursday we will be analysing this Cross on a daily basis as part of our new service for Individual traders. We look forward to welcoming new members and free trialists to this new service.


