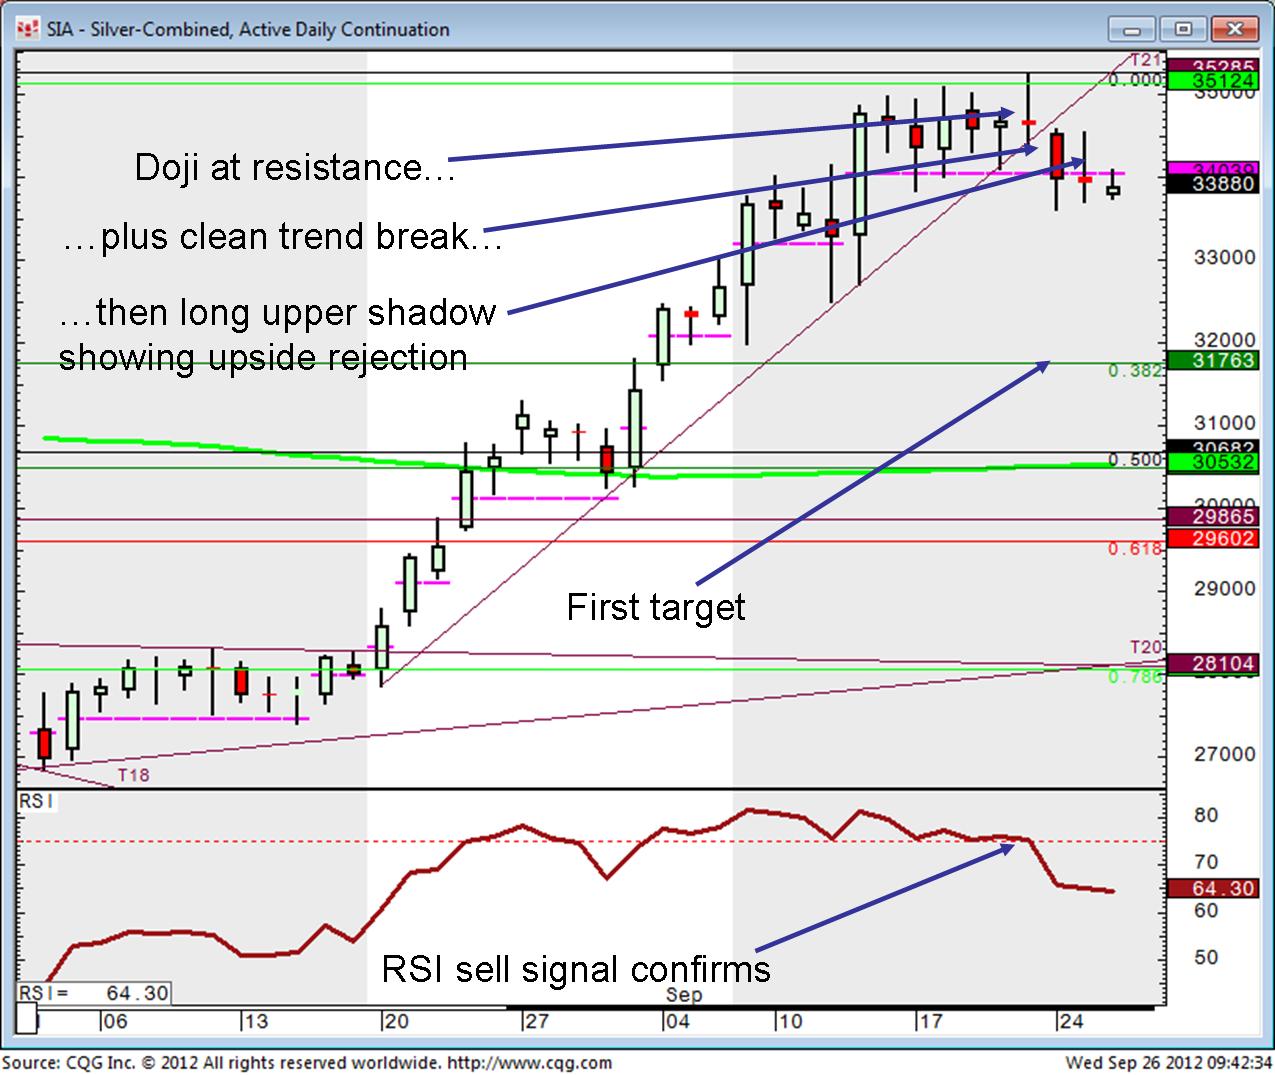
Our clients will be well aware that we have been getting increasingly bearish of Silver in recent days. Let’s have a look at what has prompted this shift in sentiment.
“Bigger picture” charts have a major Fibonacci resistance at 35.16. This is 38.2% of the sell off from the 2011 high. Shorter term Fibonacci retracement analysis suggested 35.12 might be a reference level. We were aware of these before the market even reached these levels and had been flagging this to clients.
The QE-inspired rally finally hit these levels on September 21st, but that day ended up as a “Doji” on the candlestick chart, a candle with a small real body, signalling an even balance between buyers and sellers. When we see a pattern like this at a major resistance zone we tend not to ignore it. We’d also been watching a short term uptrend line that had done a good job of defining the strong recent gains.
This line broke on Monday, and suddenly all the bearish factors mentioned above started to get some confirmation. Price action since then has seen rallies sold into, and as we head into a new session a break of 33.63 to target 31.80 is the call from FuturesTechs Mews.
31.80 is the 38.2% Fibonacci retrace of the rally from late June, although a pullback could easily extend as far as 29.80-30.30.
FuturesTechs produces daily Technical Reports for Gold and Silver Futures as well as a number of Oil and Energy contracts, plus a weekly comment on Corn, Wheat and Soybeans.
We also write daily analysis on Fixed Income and Equity Index Futures, and Forex majors.
For 12 years we have been a market leader in provision of analysis to traders in these markets.
Feel free to request a FREE TRIAL of our analysis.

