Cast your minds back to May 6th 2010 when the Dow dropped close to 1000 points in a heartbeat. Clearly a Robot/Computer somewhere had “had a moment”.
Cast your minds back to June 8th 2011, when two Algorithmic trading machines went “Head to Head” in the overnight session in Natural Gas. We posted the chart on our Blog the next day under the title “When Algo goes bad”. Here’s the link for that Blog post to refresh your memories:
It appears there’s been a few more incidences of this of late, so let’s have a look at them:
First up there was the August 1st “Knight-mare”. All I can say is thank goodness this didn’t cause ANOTHER Broker to fold, a testament to the Management of that firm, I’d say.
But Exchange Traded Futures are my speciality, so I’ll stick to what I’ve been seeing there.
Now the LIFFE Short Sterling Futures market isn’t the most exciting hunting ground for Volatility junkies, in fact recent years have seen daily ranges get even tighter as the BoE (and all the other Central Banks) have kept rates firmly on the floor.
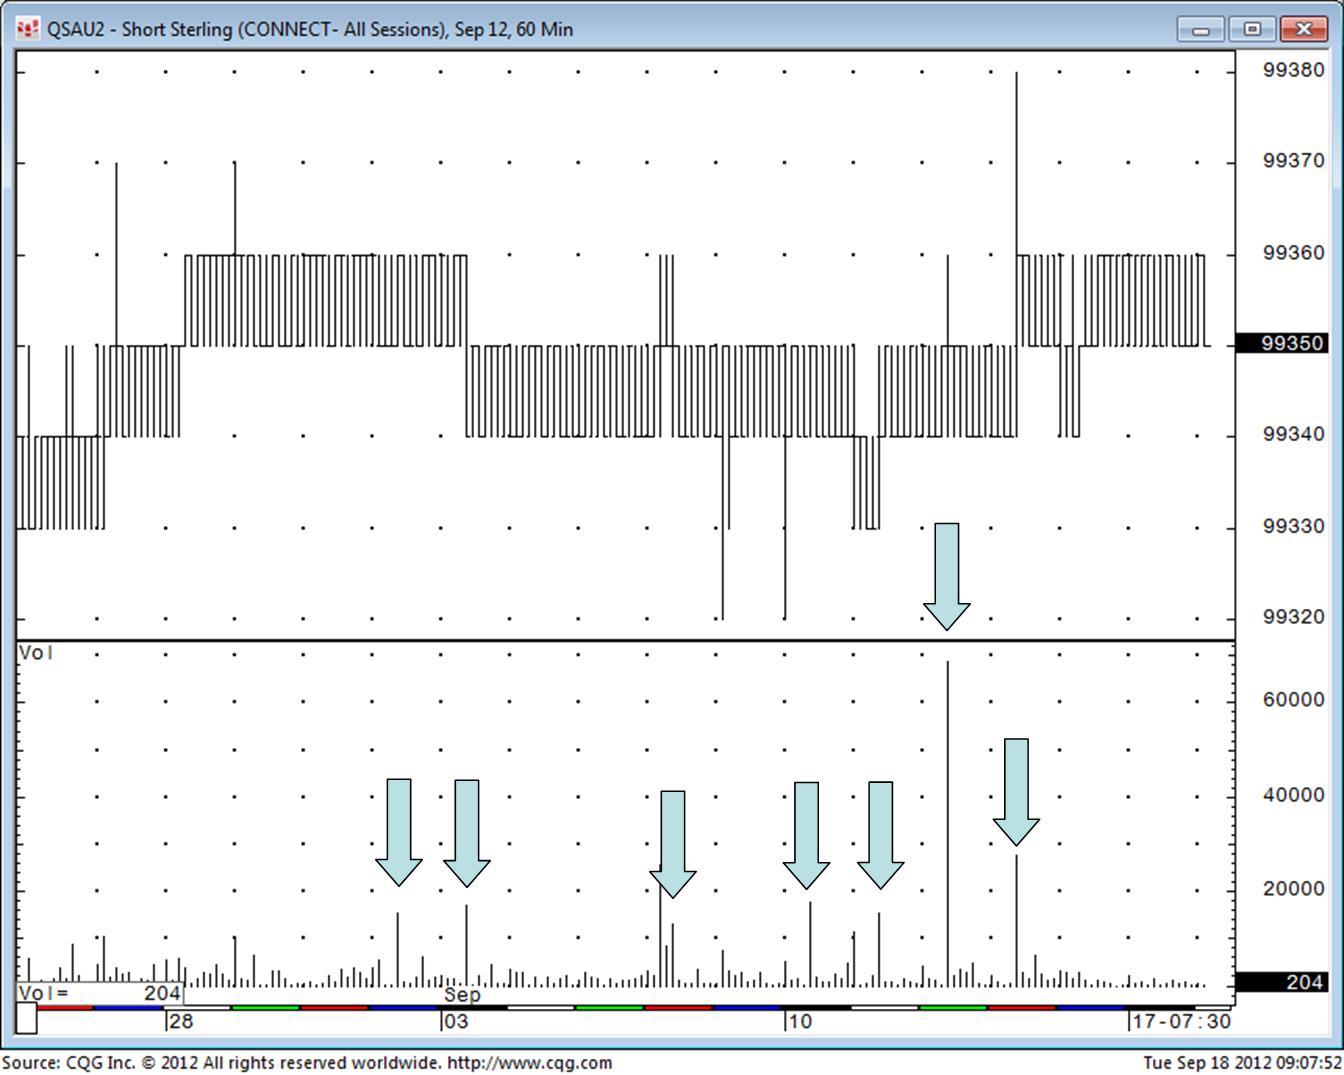
Look at the chart below:
Unremarkable from a price point of view, sure, but what I want to highlight (and have hopefully done so with all those blue arrows) is the BIG volume spikes that suddenly started to appear from July 31st, each one at exactly 11.30am in the morning. Volume spikes like this are common on opens, closes and Economic releases, yes, but for no reason at the same time each day for 7 sessions out of 10? Strange… And as quickly as this phenomenon started it was all over. It appears that the “11.30am Sep ’12 buying the 35’s Bot” got switched off after it’s efforts on September 13th, which actually surprised me because the Volume seen on the 12th was by far the biggest yet, with two “lumps” being lifted in one hit (15,000 and 30,000 lots). On the 12th a total of 68,000 lots went through at 35, but price did not budge….
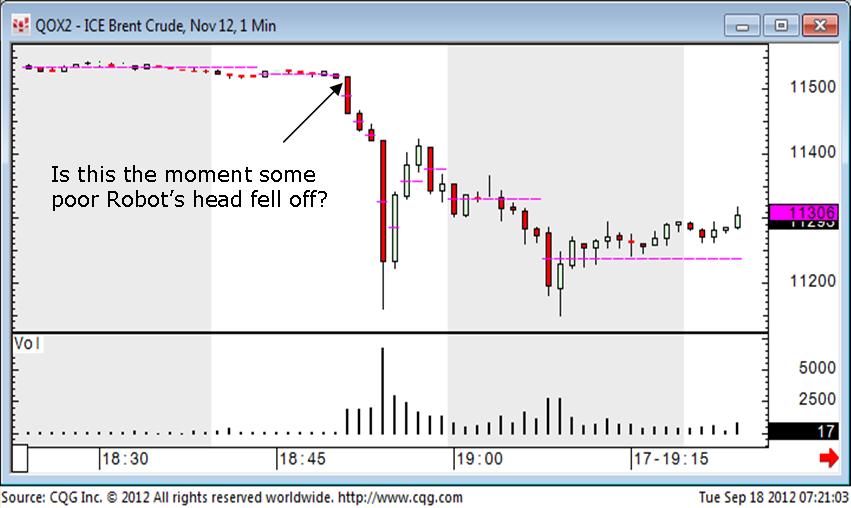
So to the next episode. Last night (September 17th) the markets were all seeing a small offer, including Brent Crude and NYMEX WTI. All of a sudden, at 18.51pm (UK Time) – DONK! As you can see from our chart below Brent dropped 360 ticks in 4 minutes. NYMEX WTI dropped 381 ticks in the same time period. the mean reversion mob inevitably reacted, but the thing I’m scratching my head about is the retest of the spike low that was seen around 19.09pm (UK).
It seems most likely this price action was the result of either a “Fat Finger” * or a Computerised trading “glitch” of some sort, and in light Volume markets these things obviously get exaggerated.
* A “Fat Finger” incase you don’t know, is the name given to a sitation where a (Human) trader may have put too many noughts on the end of an order, and sold 4000 Brent instead of 40, for example”. In this instance the second sell off suggests to me this wasn’t the case.
This morning I have commented a number of times about this “event” on Twitter (@Futurestechs) One of my loyal clients decided to “pull my leg” and call me a Luddite for my apparent “Algo bashing”. Instead of laughing off this crude attempt to wind me up I “bit” big style! Not even a slight nibble. Here was my rant, which took three Tweets due to that bloody 140 character rule! (Hash tag shut him up!)
Tweet 1: I’m all for positive progress, and was always a proponent of “floor to screens”…
Tweet 2: …however when “progress” turns out to be destructive it needs looking at…
Tweet 3: …and these sort of things only serve to reduce confidence in Exchanges and Markets in general..
I think that sums up where I am quite nicely, as it goes.
Have a good day, all, and watch out for those rogue Robots. You don’t want to be caught up in an ED209 moment, eh? (One for the geeks, that, sorry James!!).
Cheers,
Clive.


currently in an investigation with SFA ; accusing exchanges of allowing manipulative trading . We are 13 months into it .