This is what we sent to our clients on Monday talking about Corn Futures:
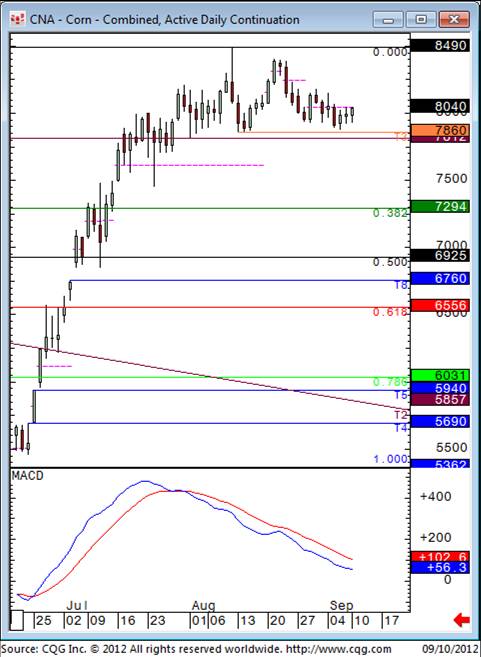
Last week’s low was 788 so bold support at 786 held firm, keeping the bulls in the box seat.
I’m not sure the scale of chart we were posting on here recently did justice to the power of the move that preceded the recent sideways consolidation, so hopefully I’ve fixed that!
It wouldn’t be a “classic” top but a break of 786 could signal a top and target a pullback to 729.4 initially.
MACD gave a sell signal a while back (the beginning of August to be precise) and hasn’t changed it’s mind since, but we need the price chart to concur, which needs a break of 786.
Alternatively this is a consolidation which will be resolved with am move through 817.4, 840 and 849, the latter being the recent all time high set on August 10th, a session that turned out to be a “Bearish Outside Day” despite the new contract high…
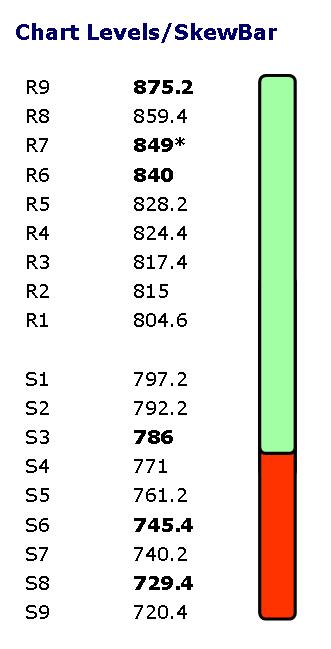
We also post support and resistance levels with all of our reports, along with our uniqur “SkewBar” to highlight short term directional “skew”. See below:
We also provde analysis on Wheat, Soybeans, Gold, Silver and the Oils complex.
For a free trial please click here.


