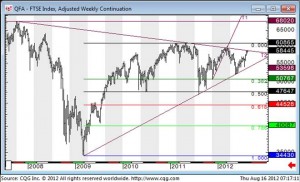
Below is the commentary and chart from the FTSE Futures report sent to our clients this morning prior to the open. We had a look at the “bigger picture” today, and it’s an interesting chart…
.
The short term charts are easy to “read” at the moment. We have seen two failures at 5860, with 5795 the low between these two highs. Between these levels there is nothing to do.
We illustrated this with a 2 hour chart yesterday.
Today’s chart sees us looking at an entirely different time horizon. It’s a Weekly Bar chart dating back to the October 2007 high.
It shows a gently sloping downtrend line that sits at 5857.5 this week, and an uptrend support line that’s at 5360 right now. So we’re testing the downtrend line, and a decision re this level could resolve the next few months: Break it and we head higher targeting 6000 then 6095 then 6396 and 6802.
Fail at 5860 (then sell off through 5795) and we can look for a pullback to 5360.
.

