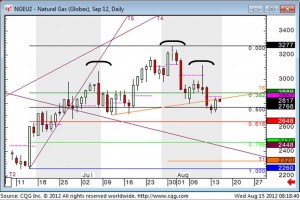
Our Natural Gas commentary from this morning highlighted a developing pattern that suggests yesterday’s gains presented a selling opportunity. Here’s a snippet from our report:
I’ve added a line to today’s chart which is slightly tentative but may be confirmed by price action today if we keep 2.837-2.857 in the resistance column.
The line is a Neckline, classing recent price action as a small “Head and Shoulders” top, with a “measured move” target of 2.324, not far away from the June low/bounce.
In other words this is a selling opportunity.
Click on the chart below to see a bigger version.
.
FuturesTechs produces daily Technical Reports for Natural Gas Futures as well as Brent Crude, NYMEX WTI, GasOil, and Carbon Emissions (ECX EUA). For 12 years we have been a market leader in provision of analysis to traders across a number of asset classes.
We also write daily analysis on Equity and Bond Futures, and Forex majors.
The reports include Support and Resistance levels (with our unique “SkewBar” trend indicator), Pivot Points and Moving Averages. We also post both Candlestick and Market Profile charts – the two mainstays of our analysis.
Please use the buttons above to request a free trial.

