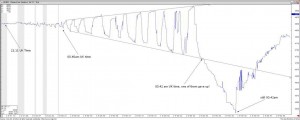
Here is a tick chart showing last night’s shenanigans in Natural Gas, where it looks like two Black Box “Algo” systems had a right good go at each other for 2 minutes, steadily increasing the range (on hardly any volume) until one of them gave up!
So I’d call this chart “When Algo goes Bad”…
Have a good day!
PS We write daily Technical Analysis on Natural Gas, as well as the entire Oil/Energy complex, Metals, Commodities, Equities and Bonds. Click here for a free trial.

